Chapter Preamble
Signals declared
Sig-D — Diagnostic (primary). Apply the diagnostic thresholds and staging, recognise the guideline differences, and stratify the patient by total cardiovascular risk.
Sig-V — Evidence-dense (strong). The continuous risk-blood-pressure relationship, the rationale for risk-based management, and the evidence behind the thresholds — graded and reflected on.
Levels populated and omitted
Populated (17): L1–L5, L7, L8, L10–L14, L18–L22. The evidence signal fires the absolute-risk table (L14) and the reflective prompts (L21); the diagnostic signal drives the tables, rules, cases, pitfalls, and board items.
L6 / L9 mechanism levels — omitted. No Sig-M; the regulatory mechanisms were built in Chapter 1, and this is a definitions and evidence chapter.
L15 / L16 preference-sensitive map and SDM scripts — omitted. No Sig-E; defining and risk-stratifying hypertension is a diagnostic and evidential process.
L17 documentation templates — omitted. No Sig-P/T; the management templates belong with the treatment chapters.
| 01 | PHASE A · LEVEL 1 · ORIENTATION & KNOWLEDGE Learning Objectives |
By the end of this chapter you should be able to:
State the diagnostic thresholds and staging of hypertension.
Explain the key differences between the ACC/AHA and ESC/ISH classifications.
Explain why blood-pressure risk is a continuum and thresholds are pragmatic cut-points.
Distinguish systolic, diastolic, and pulse pressure and recognise isolated systolic hypertension.
Explain why hypertension is managed by total cardiovascular risk, not blood pressure alone.
List the components of total cardiovascular risk and the risk calculators.
Assess for hypertension-mediated target-organ damage.
Summarise the evidence that treatment benefit scales with baseline risk.
| 02 | PHASE A · LEVEL 2 · ORIENTATION & KNOWLEDGE Executive Summary |
Hypertension is defined by blood-pressure thresholds, but the thresholds differ between guidelines and the underlying risk is a continuum.
The ACC/AHA classification lowered the diagnostic threshold, defining stage 1 hypertension at 130/80 and stage 2 at 140/90.
The ESC and international (ISH) classifications keep a diagnostic threshold of 140/90, grading hypertension from grade 1 upward, with a high-normal category below it.
The key difference is the threshold (130/80 versus 140/90), but both ultimately tie treatment to cardiovascular risk.
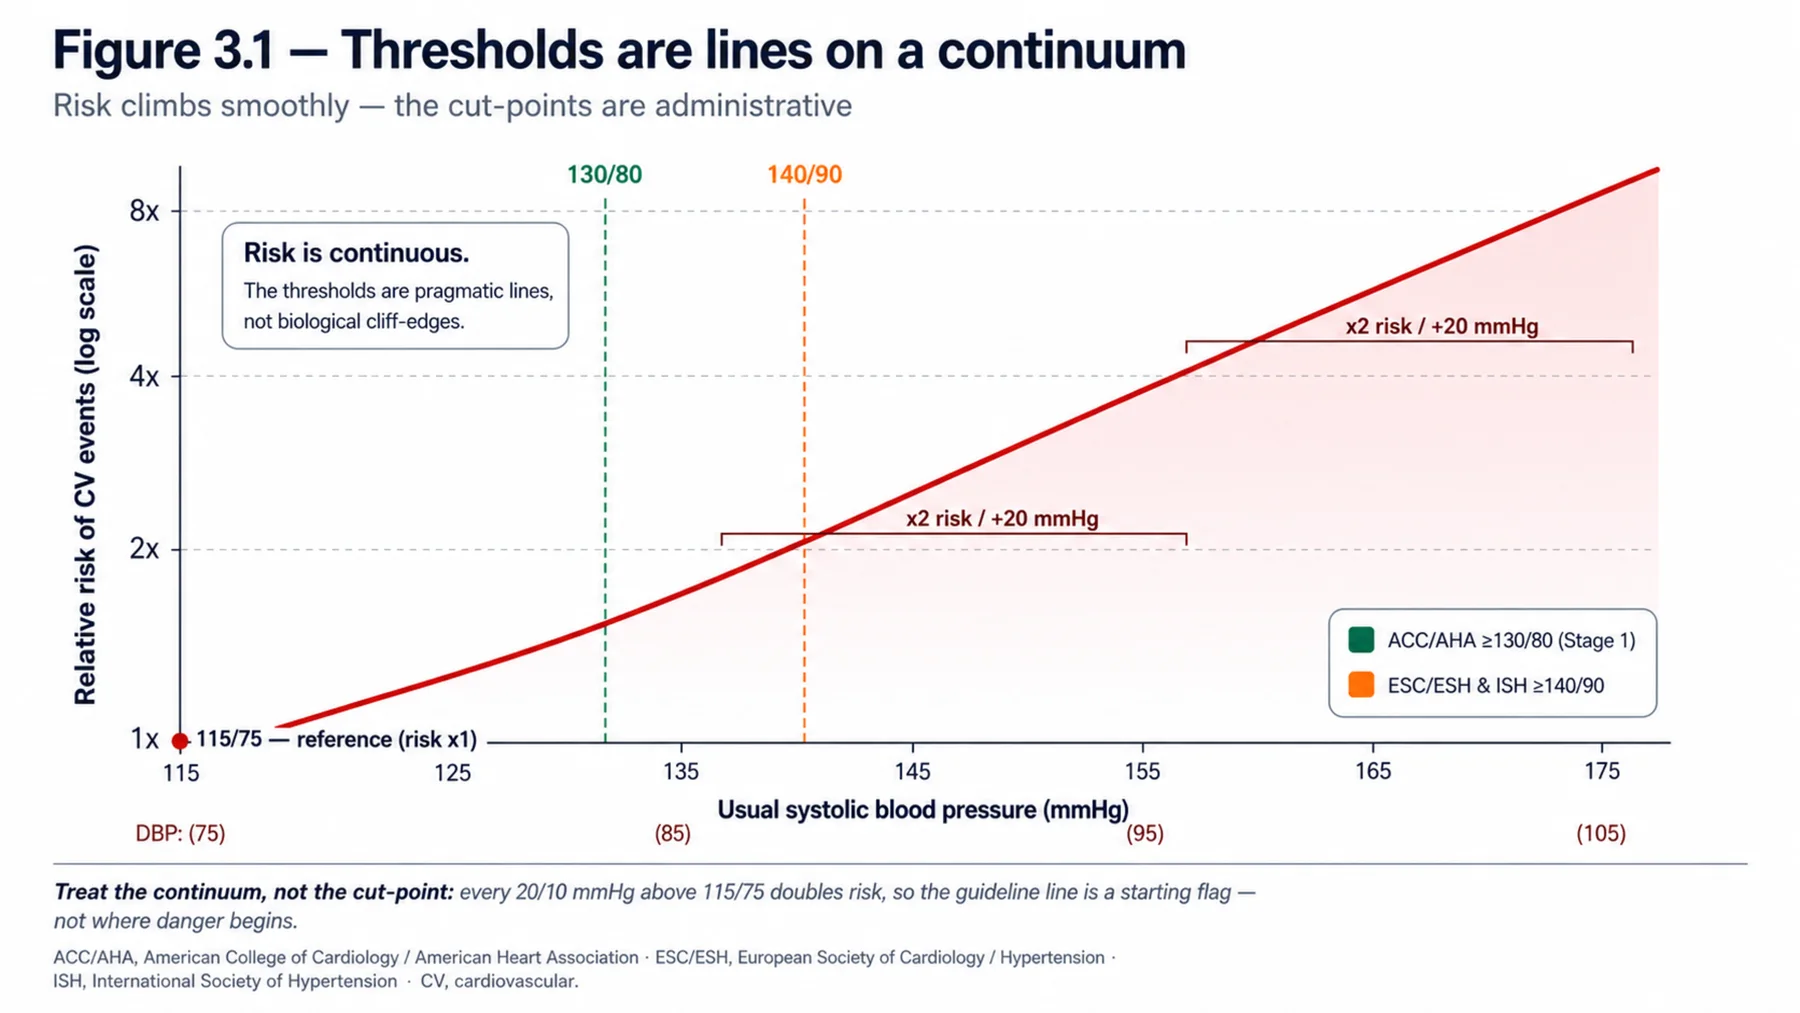
Cardiovascular risk rises continuously with blood pressure from about 115/75 upward, so the thresholds are pragmatic cut-points on a continuum, not biological boundaries.
Systolic pressure is the more important predictor beyond middle age, and isolated systolic hypertension, from arterial stiffening, is common in the elderly with a widened pulse pressure.
Hypertension is a cardiovascular risk factor rather than a disease in itself, so it is managed by the patient's total cardiovascular risk, not the blood pressure alone.
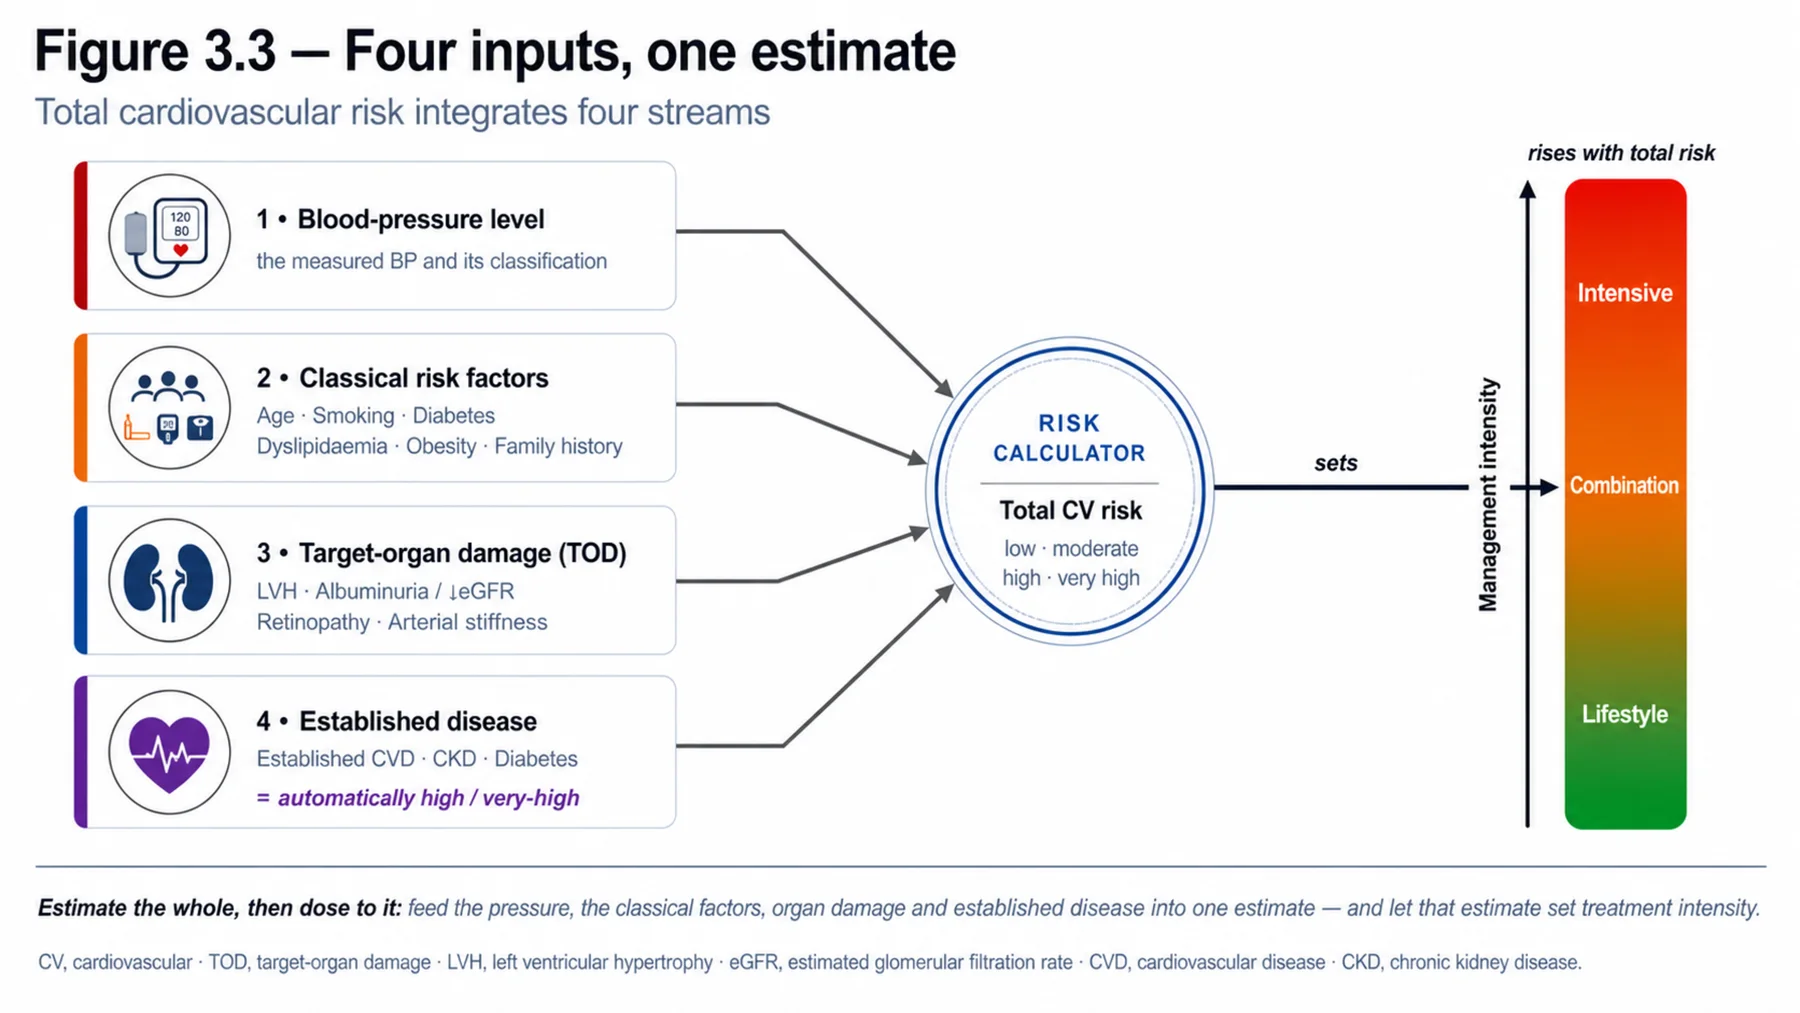
Total risk integrates the blood-pressure level with other risk factors, hypertension-mediated target-organ damage, and established cardiovascular, renal, or diabetic disease.
Target-organ damage — left ventricular hypertrophy, albuminuria and reduced eGFR, retinopathy, arterial stiffness — raises the risk and should be sought.
Risk is estimated with calculators such as SCORE2, the pooled cohort equations, and QRISK.
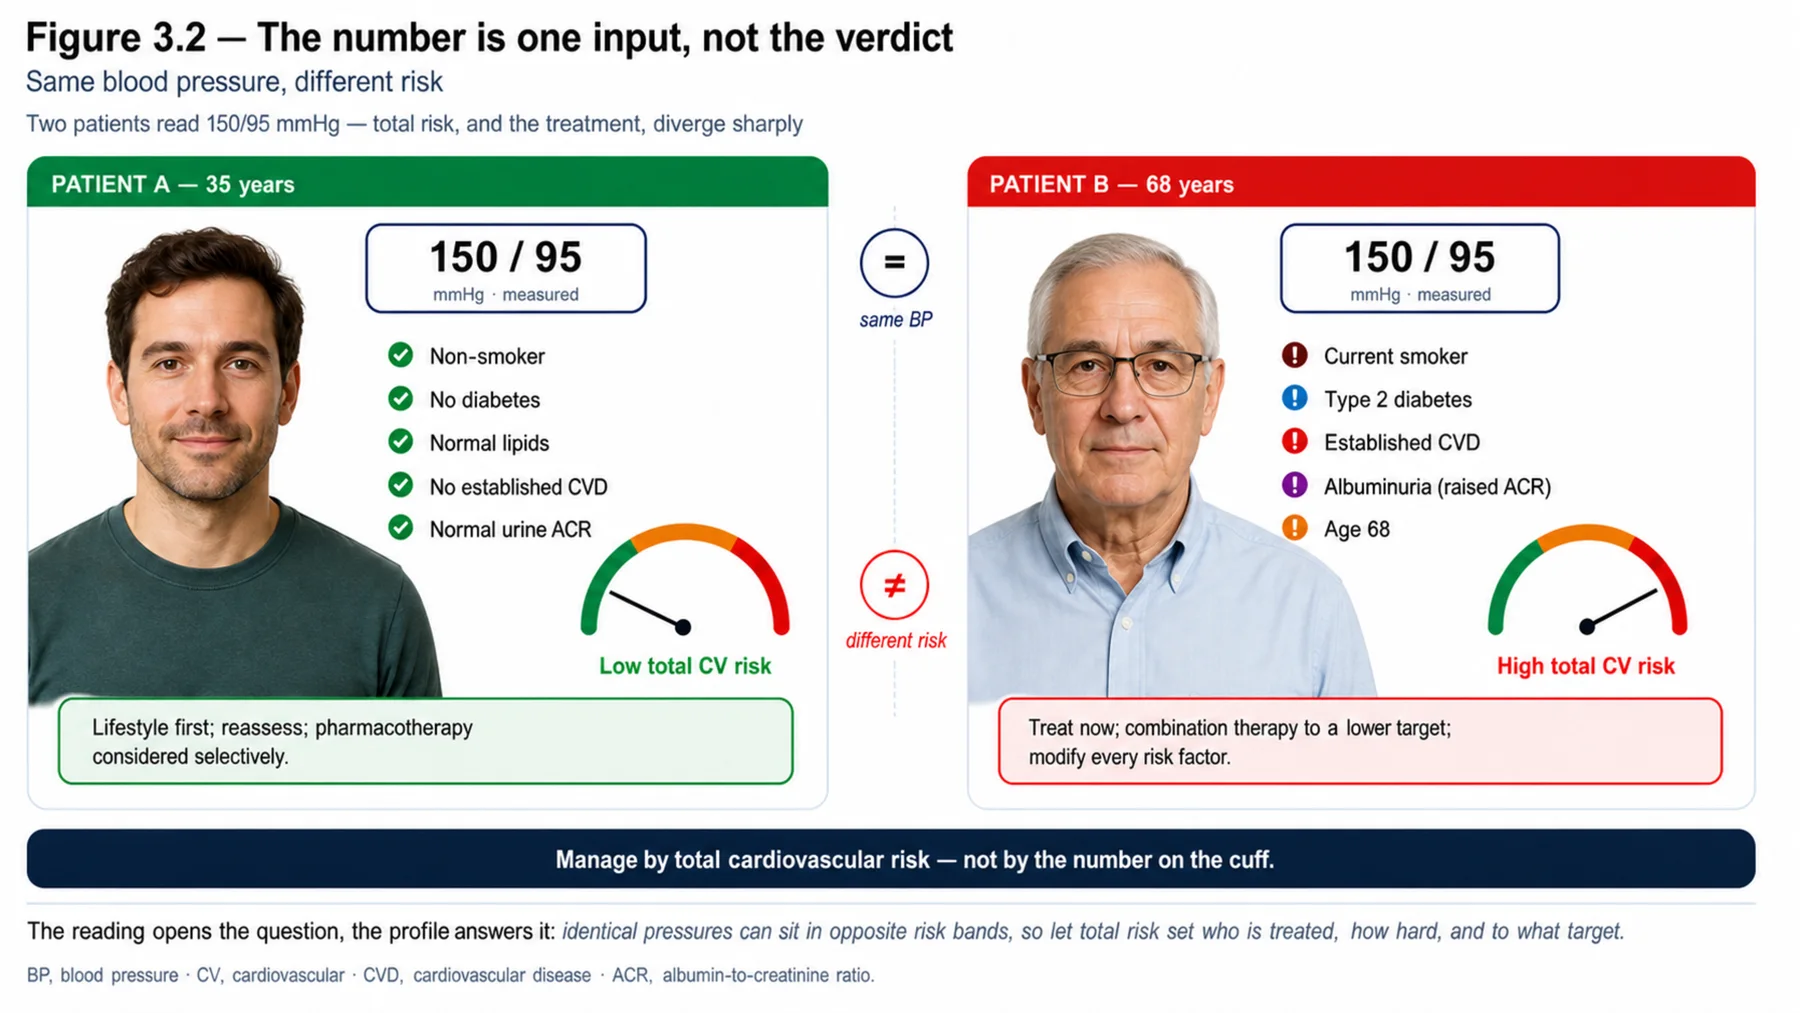
The same blood pressure carries very different absolute risk depending on the rest of the picture.
The absolute benefit of blood-pressure lowering scales with baseline risk, so higher-risk patients are treated more readily and to lower targets.
This risk-based framework is why the guideline threshold matters less than the total assessment.
Defining and classifying hypertension is therefore inseparable from estimating cardiovascular risk.
| 03 | PHASE A · LEVEL 3 · ORIENTATION & KNOWLEDGE Main Narrative |
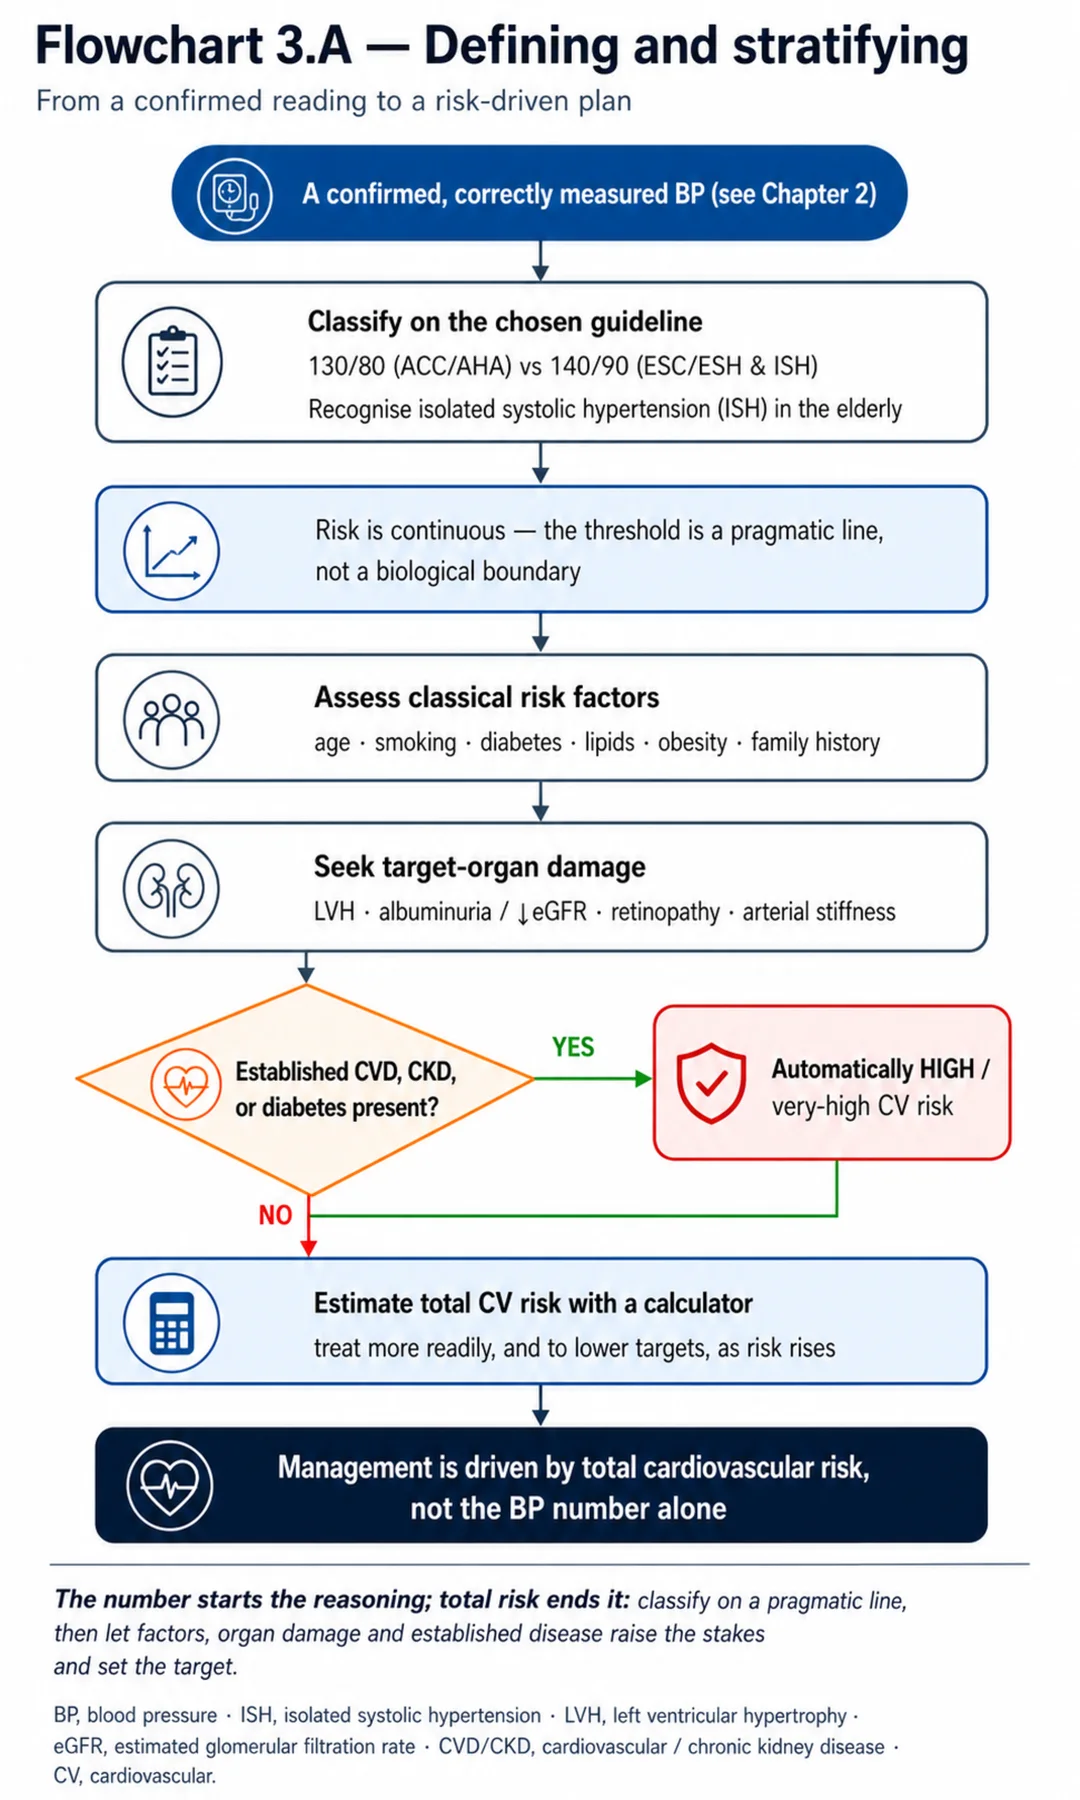
What counts as hypertension is partly a matter of definition — and the definitions differ. One major guideline calls 130/80 hypertension; another reserves the label for 140/90. The disagreement is real but, in a sense, secondary, because the deeper truth is that cardiovascular risk rises continuously with blood pressure, and the thresholds are pragmatic lines drawn on a continuum. This chapter sets out the classifications, explains the continuum, and makes the central point that hypertension is managed by total cardiovascular risk, not by the blood-pressure number alone.
— The classifications, and their key difference
Two classification systems dominate. The American (ACC/AHA) system lowered the diagnostic threshold: normal blood pressure is below 120/80, 'elevated' is 120 to 129 systolic, stage 1 hypertension is 130 to 139 / 80 to 89, and stage 2 is 140/90 or above. The European and international (ESC, ISH) systems keep the diagnostic threshold at 140/90: below that lie optimal, normal, and high-normal categories, and at and above 140/90 hypertension is graded 1, 2, and 3 by increasing severity. The headline difference is the threshold — 130/80 in the American system, 140/90 in the European — which means a patient at, say, 135/85 is 'stage 1 hypertensive' by one system and 'high-normal' by the other. But the difference is less consequential than it appears, because both systems ultimately tie the decision to treat to the patient's cardiovascular risk, not to the label alone: the American system, having lowered the threshold, recommends drug treatment in the 130 to 139 range mainly for higher-risk patients, converging in practice with the European risk-based approach. The thresholds differ; the risk-based logic is shared. (Guidelines continue to be revised, so the exact categories should be checked against the current version.)
— The continuum of risk
The reason the thresholds are somewhat arbitrary is that the relationship between blood pressure and cardiovascular risk is continuous: risk begins to rise from around 115/75 mmHg and roughly doubles for each increment of about 20 systolic or 10 diastolic mmHg, with no threshold below which risk is zero or above which it suddenly jumps. The diagnostic cut-points are pragmatic devices — lines drawn on a smooth curve to create actionable categories — not biological boundaries. This has two implications. First, a patient just below a threshold is not 'safe'; they sit slightly lower on the same continuous curve. Second, where exactly to draw the treatment line is a judgement that depends on the balance of benefit and harm at that level of risk, which is precisely why the guidelines, looking at the same continuous evidence, draw their lines in slightly different places. Holding the continuum in mind — risk rising smoothly with pressure — prevents the error of treating the threshold as a magic number.
— Systolic, diastolic, and isolated systolic hypertension
Which component of the blood pressure matters most changes with age. In younger patients, diastolic pressure is a strong predictor, but beyond middle age (roughly past 50 to 55) systolic pressure becomes the dominant predictor of cardiovascular risk, and the pulse pressure (the difference between systolic and diastolic) widens. This shift reflects arterial stiffening: as the large arteries stiffen with age, the systolic pressure rises while the diastolic falls or plateaus, producing isolated systolic hypertension — a systolic pressure at or above 140 with a normal diastolic — which is the commonest pattern of hypertension in the elderly and a genuine, treatable cardiovascular risk, not a benign consequence of ageing. Recognising isolated systolic hypertension matters because it is sometimes under-treated on the mistaken view that a normal diastolic makes it benign, when in fact the elevated systolic and widened pulse pressure carry substantial risk.
— Hypertension as a risk factor, not a disease
The conceptual heart of the chapter is that hypertension is best understood as a cardiovascular risk factor rather than a disease in its own right, and is therefore managed according to the patient's total cardiovascular risk, not the blood-pressure number alone. The same blood pressure carries very different absolute risk depending on the rest of the picture: a 150/95 in a young person with no other risk factors carries far less absolute risk than the same 150/95 in an older smoker with diabetes, established coronary disease, and albuminuria. Total cardiovascular risk integrates the blood-pressure level with the other classical risk factors (age, sex, smoking, dyslipidaemia, diabetes, obesity, family history), with hypertension-mediated target-organ damage, and with established cardiovascular, renal, or diabetic disease (which place the patient automatically at high risk). This integrated assessment, not the blood pressure in isolation, is what should drive the decision to treat and how aggressively — which is why two patients with identical blood pressures may rightly be managed very differently.
— Target-organ damage and risk estimation
Two tools refine the risk assessment. The first is the search for hypertension-mediated target-organ damage — the silent injury hypertension inflicts before symptoms appear, the presence of which marks higher risk and often tips the decision to treat. The standard assessment looks for left ventricular hypertrophy (ECG, and echocardiography where available), renal damage (the urine albumin-to-creatinine ratio and the eGFR), hypertensive retinopathy (fundoscopy), and vascular changes (ankle-brachial index, arterial stiffness by pulse-wave velocity). The second is the formal risk calculator — SCORE2 and its older-person version in Europe, the pooled cohort equations in the United States, QRISK in the United Kingdom, and others — which estimate the ten-year cardiovascular risk by combining the risk factors quantitatively. Together, target-organ damage and the calculators move the assessment from 'how high is the blood pressure?' to 'how much cardiovascular risk does this patient carry?' — the question that actually determines management.
— Why risk-based management, and what it means
The evidence that justifies the risk-based framework is that the absolute benefit of lowering blood pressure scales with the baseline risk. Relative risk reduction from blood-pressure lowering is fairly constant across patients, but because the higher-risk patient starts from a much higher absolute risk, the same relative reduction translates into a much larger absolute benefit — more events prevented per patient treated. So treating the high-risk patient yields more benefit for the same blood-pressure reduction than treating the low-risk patient, which is the rationale for treating higher-risk patients more readily (at lower thresholds) and to lower targets, while being more conservative in the low-risk patient where the absolute benefit, and the number needed to treat, are less favourable. This is why the guideline threshold matters less than the total risk assessment: the threshold tells you the patient has hypertension, but the risk tells you how much they will benefit from treating it. Defining and classifying hypertension is, in the end, inseparable from estimating cardiovascular risk — and the chapters that follow, on treatment, all presuppose that the decision to treat and the intensity of treatment are set by that risk.
| 04 | PHASE A · LEVEL 4 · ORIENTATION & KNOWLEDGE Reference Tables |
Table 3.1 — The two classifications (approximate)
| Category | ACC/AHA | ESC / ISH |
| Below diagnosis | Normal < 120/80; Elevated 120–129/<80 | Optimal/normal/high-normal up to 139/89 |
| Stage/grade 1 | 130–139 / 80–89 | 140–159 / 90–99 |
| Stage/grade 2 | ≥ 140/90 | 160–179 / 100–109 |
| Grade 3 | (within stage 2) | ≥ 180/110 |
Table 3.2 — The continuum of risk
| Point | Detail |
| Continuous relationship | Risk rises from ~115/75 mmHg upward |
| Magnitude | Roughly doubles per ~20/10 mmHg increment |
| Thresholds | Pragmatic cut-points on a smooth curve — not biological boundaries |
| Implication | Just below a threshold is not 'safe'; where to draw the line depends on risk |
Table 3.3 — Systolic, diastolic, and pulse pressure
| Aspect | Detail |
| Younger patients | Diastolic a strong predictor |
| Beyond ~50–55 years | Systolic the dominant predictor |
| Isolated systolic hypertension | SBP ≥ 140 with normal DBP — arterial stiffening, common in elderly |
| Pulse pressure | Widens with stiffening — a marker of risk |
Table 3.4 — Components of total cardiovascular risk
| Component | Examples |
| Blood-pressure level | The grade/stage |
| Other risk factors | Age, sex, smoking, dyslipidaemia, diabetes, obesity, family history |
| Target-organ damage | LVH, albuminuria/reduced eGFR, retinopathy, arterial stiffness |
| Established disease | Cardiovascular, renal, or diabetic disease — automatically high risk |
Table 3.5 — Risk calculators and target-organ assessment
| Tool | Detail |
| Risk calculators | SCORE2/SCORE2-OP (Europe), pooled cohort equations (US), QRISK (UK) |
| Cardiac | ECG (± echocardiography) for left ventricular hypertrophy |
| Renal | Urine albumin:creatinine ratio + eGFR |
| Other | Fundoscopy (retinopathy); ankle-brachial index; pulse-wave velocity |
Table 3.6 — Why risk-based management
| Principle | Detail |
| Same BP, different risk | Absolute risk depends on the whole picture, not the number alone |
| Benefit scales with risk | Absolute benefit of BP lowering is greater at higher baseline risk |
| Higher-risk patients | Treated more readily (lower threshold) and to lower targets |
| The threshold matters less | Than the total cardiovascular risk assessment |
| 05 | PHASE B · LEVEL 5 · VISUALISE & MAP Imaging & Flowchart Specifications |
| 08 | PHASE C · LEVEL 8 · CLINICAL REASONING Clinical Cases |
| CASE 1 | STAGE 1 OR HIGH-NORMAL? The guideline difference Classification and the threshold |
Presentation
A patient with a confirmed out-of-office blood pressure of 135/85 is labelled 'stage 1 hypertension' by one clinician (using the American classification) and 'high-normal' by another (using the European). The patient is confused about whether they have hypertension.
❖ Pause and reflect Which clinician is right, and does it change the management? |
Analysis
Both are 'right' by their own classification — 135/85 is stage 1 by the ACC/AHA threshold of 130/80 and high-normal by the ESC threshold of 140/90 — because the systems draw the diagnostic line in different places on the same continuum. But the disagreement matters less than it seems, because both systems tie the decision to treat to cardiovascular risk: at 135/85, both would recommend lifestyle measures and would reserve drug therapy mainly for higher-risk patients. The label differs; the management, driven by risk, largely converges. The right answer to the patient is that the number sits on a continuum and what matters is their total cardiovascular risk.
Plan
Explain that the label depends on the classification used, that risk is continuous, and that management at this level is driven by the patient's total cardiovascular risk — lifestyle for all, drugs for the higher-risk. Focus on the risk, not the label.
Teaching point
The ACC/AHA (130/80) and ESC (140/90) thresholds differ, but both tie treatment to risk — the label matters less than the total risk.
Cross-reference
Exercises the classification and continuum content; Figure 3.1; Tables 3.1, 3.2.
| CASE 2 | SAME NUMBER, DIFFERENT RISK Manage by total risk Risk stratification |
Presentation
Two patients each have a blood pressure of 150/95. One is a fit 35-year-old with no other risk factors; the other is a 68-year-old smoker with diabetes, prior myocardial infarction, and albuminuria. A trainee proposes the same management for both.
❖ Pause and reflect Should two patients with the same blood pressure be managed identically? |
Analysis
No — because the same blood pressure carries very different absolute risk in these two patients. The young patient with no other risk factors has a low total cardiovascular risk, so the absolute benefit of drug treatment is modest, and lifestyle measures with monitoring may be appropriate first. The older patient with diabetes, established coronary disease, and albuminuria is at high total risk — indeed established disease makes them automatically high-risk — so the absolute benefit of blood-pressure lowering is large, and prompt, more intensive treatment to a lower target is warranted. The blood pressure is identical; the management diverges because the total risk diverges.
Plan
Manage by total cardiovascular risk: lifestyle and monitoring (with risk reassessment) for the low-risk young patient, and prompt, more intensive treatment to a lower target for the high-risk older patient. Treat the risk, not just the number.
Teaching point
The same blood pressure carries different absolute risk — manage hypertension by total cardiovascular risk, not the number alone.
Cross-reference
Exercises the risk-based principle; Figure 3.2; Tables 3.4, 3.6.
| CASE 3 | JUST THE SYSTOLIC Not benign Isolated systolic hypertension |
Presentation
An 80-year-old has a blood pressure of 165/78 — an elevated systolic with a normal diastolic. A clinician judges this benign because 'the diastolic is fine' and declines to treat.
❖ Pause and reflect Is isolated systolic hypertension benign because the diastolic is normal? |
Analysis
No — this is isolated systolic hypertension, and it is a genuine, treatable cardiovascular risk, not a benign consequence of ageing. With age the large arteries stiffen, raising the systolic and lowering or plateauing the diastolic, producing a high systolic with a normal or low diastolic and a widened pulse pressure. Beyond middle age the systolic is the dominant predictor of cardiovascular risk, so the elevated systolic here carries substantial risk despite the normal diastolic. Dismissing it as benign because the diastolic is normal is a recognised error that leaves elderly patients under-treated.
Plan
Recognise the isolated systolic hypertension as a real cardiovascular risk, assess the total risk, and treat the systolic pressure (carefully, given the age — the elderly chapter develops this) rather than dismissing it because the diastolic is normal. Treat the systolic in isolated systolic hypertension.
Teaching point
Isolated systolic hypertension (high systolic, normal diastolic) is a real, treatable risk — not benign because the diastolic is normal.
Cross-reference
Exercises the systolic/pulse-pressure content; Table 3.3; the elderly in Chapter 16.
| CASE 4 | THE SILENT DAMAGE Target-organ damage tips the balance Hypertension-mediated organ damage |
Presentation
A patient with a borderline blood pressure and otherwise few risk factors is found, on assessment, to have left ventricular hypertrophy on ECG and albuminuria. The team had been inclined to defer treatment.
❖ Pause and reflect How does the target-organ damage change the assessment? |
Analysis
It changes it substantially. Left ventricular hypertrophy and albuminuria are hypertension-mediated target-organ damage — the silent injury hypertension inflicts before symptoms — and their presence marks a higher total cardiovascular risk than the blood pressure and risk factors alone would suggest, often tipping the balance toward treatment. The borderline blood pressure that might have been observed in a patient with no organ damage should be treated here, because the organ damage reveals that the hypertension is already doing harm. Seeking target-organ damage is precisely how the risk assessment is refined beyond the number.
Plan
Treat the hypertension given the target-organ damage (which raises the total risk and signals ongoing harm), use agents that address the albuminuria (RAAS blockade), and monitor the organ damage over time. Let target-organ damage inform the decision to treat.
Teaching point
Target-organ damage (LVH, albuminuria) raises the total risk and signals ongoing harm — it tips the balance toward treatment.
Cross-reference
Exercises the target-organ-damage content; Figure 3.3; Tables 3.4, 3.5; nephrosclerosis in Chapter 12.
| 10 | PHASE C · LEVEL 10 · CLINICAL REASONING Clinical Pearls |
| Hypertension thresholds differ: ACC/AHA 130/80, ESC/ISH 140/90. | ACC/AHA: stage 1 130–139/80–89; stage 2 ≥140/90. |
| ESC/ISH: grade 1 140–159/90–99; grade 2 160–179/100–109; grade 3 ≥180/110. | Both tie treatment to cardiovascular risk — the label matters less than the risk. |
| Risk is a CONTINUUM — rises from ~115/75, doubles per ~20/10 mmHg. | Thresholds are pragmatic cut-points, not biological boundaries. |
| Systolic dominates risk beyond ~50–55 years. | Isolated systolic hypertension (high SBP, normal DBP) = real, treatable risk. |
| Widened pulse pressure (arterial stiffening) = a risk marker. | Hypertension is a risk FACTOR, not a disease — manage by total risk. |
| Total risk = BP + risk factors + target-organ damage + established disease. | Established CVD/CKD/diabetes → automatically high risk. |
| Target-organ damage: LVH, albuminuria/reduced eGFR, retinopathy, arterial stiffness. | Assess TOD: ECG/echo, urine ACR + eGFR, fundoscopy, ABI/PWV. |
| Risk calculators: SCORE2, pooled cohort equations, QRISK. | Absolute benefit of BP lowering scales with baseline risk. |
| 11 | PHASE D · LEVEL 11 · SAFETY & EVIDENCE Red Flags & Never-Do |
Panel A — Red flags
| ▲ | Treating the threshold as a magic number — risk is continuous; just below is not 'safe.' |
| ▲ | Identical management for two patients with the same BP but very different total risk — manage by risk. |
| ▲ | Dismissing isolated systolic hypertension because the diastolic is normal — it is a real risk. |
| ▲ | A borderline BP with LVH or albuminuria — target-organ damage raises the risk; treat. |
| ▲ | Established CVD, CKD, or diabetes — automatically high risk; lower threshold and target. |
Panel B — Never do
| ✖ NEVER — treat the diagnostic threshold as a biological boundary on a continuous risk curve. |
| ✖ NEVER — manage hypertension by the blood-pressure number alone, ignoring total risk. |
| ✖ NEVER — dismiss isolated systolic hypertension as benign. |
| ✖ NEVER — omit the search for target-organ damage when stratifying risk. |
| 12 | PHASE D · LEVEL 12 · SAFETY & EVIDENCE Common Pitfalls |
Pitfall 1 — The magic threshold
| ✖ | WRONG Treating just-below-threshold as safe and just-above as dangerous. |
| ✓ | RIGHT Recognising risk as continuous and the threshold as pragmatic. |
| ✉ | WHY Risk rises smoothly from ~115/75 with no biological boundary. |
Pitfall 2 — The number alone
| ✖ | WRONG Managing two patients with the same BP identically. |
| ✓ | RIGHT Managing each by total cardiovascular risk. |
| ✉ | WHY The same BP carries very different absolute risk. |
Pitfall 3 — Dismissing systolic hypertension
| ✖ | WRONG Calling isolated systolic hypertension benign because the diastolic is normal. |
| ✓ | RIGHT Treating it as a real cardiovascular risk. |
| ✉ | WHY Systolic pressure dominates risk beyond middle age. |
Pitfall 4 — Skipping target-organ damage
| ✖ | WRONG Stratifying risk without seeking organ damage. |
| ✓ | RIGHT Assessing for LVH, albuminuria, retinopathy, and arterial stiffness. |
| ✉ | WHY Organ damage raises the risk and signals ongoing harm. |
Pitfall 5 — Ignoring established disease
| ✖ | WRONG Treating a patient with established CVD/CKD as average-risk. |
| ✓ | RIGHT Recognising them as automatically high-risk. |
| ✉ | WHY Established disease places the patient at high absolute risk. |
| 13 | PHASE D · LEVEL 13 · SAFETY & EVIDENCE Evidence Grading |
GRADE A HIGH CONFIDENCE The effect is real and the estimate is stable. RCTs at low risk of bias; multiple concordant prospective cohorts; meta-analyses. |
GRADE B MODERATE CONFIDENCE The effect is likely real but may shift with new data. Observational studies, registries, mechanistic human studies. |
GRADE C LOW CONFIDENCE Rests on physiology, reasoning, or consensus rather than outcomes. Pathophysiological reasoning; extrapolation; consensus without outcomes. |
Graded statements (by evidence type)
| Statement | Grade | Basis (evidence type) |
| Cardiovascular risk rises continuously with blood pressure from ~115/75. | A | Large epidemiological data |
| Diagnostic thresholds are pragmatic cut-points on a continuum. | A | Epidemiology and guideline consensus |
| Systolic pressure dominates risk beyond middle age. | A | Cohort data |
| Isolated systolic hypertension is a treatable cardiovascular risk. | A | RCTs in the elderly |
| Hypertension is managed by total cardiovascular risk. | A | Guideline consensus and trial data |
| Absolute benefit of BP lowering scales with baseline risk. | A | Meta-analyses of RCTs |
| Target-organ damage raises cardiovascular risk. | A | Prospective cohort data |
| 14 | PHASE E · LEVEL 14 · PATIENT DECISIONS Absolute Risk in Natural Frequency |
Natural-frequency estimates for orientation, from the hypertension evidence; they vary with population. They convey the size of the decisions, expressed per 100 comparable patients.
| Per 100 patients… | Outcome | Roughly how many | See |
| High-risk patients treated vs low-risk, same BP reduction | Events prevented | More in the high-risk group | L13 row 6 |
| With the same blood pressure | Differ in absolute risk by the rest of the picture | Markedly — hence risk-based management | L13 row 5 |
| Elderly with isolated systolic hypertension treated | Avoid cardiovascular events | More than the untreated | L13 row 4 |
| With target-organ damage at a given BP | Are at higher risk than those without | More events — hence seek it | L13 row 7 |
★ How to read these Read these as orientation, not promises; absolute risk varies with the whole picture. The stable signals: benefit scales with baseline risk, the same blood pressure carries different risk, treating isolated systolic hypertension helps, and organ damage raises risk. Communicate them as people out of 100, not as a hazard ratio. |
| 18 | PHASE F · LEVEL 18 · APPLY & TEST Cheat Sheet |
| Thresholds: ACC/AHA 130/80; ESC/ISH 140/90. | ACC/AHA stage 1 130–139/80–89; stage 2 ≥140/90. |
| ESC grade 1 140–159/90–99; grade 2 160–179/100–109; grade 3 ≥180/110. | Both tie treatment to risk — label matters less than risk. |
| Risk is CONTINUOUS (from ~115/75; doubles per ~20/10 mmHg). | Thresholds = pragmatic cut-points. |
| Systolic dominates beyond ~50–55 yr. | Isolated systolic HTN = real, treatable risk (not benign). |
| Hypertension = risk FACTOR, not a disease. | Manage by TOTAL cardiovascular risk. |
| Total risk = BP + risk factors + TOD + established disease. | Established CVD/CKD/diabetes = automatically high risk. |
| TOD: LVH, albuminuria/eGFR, retinopathy, arterial stiffness. | Assess: ECG/echo, urine ACR+eGFR, fundoscopy, ABI/PWV. |
| Calculators: SCORE2, pooled cohort equations, QRISK. | Benefit scales with baseline risk. |
| 19 | PHASE F · LEVEL 19 · APPLY & TEST Flashcards |
| CARD 1 | Q. How do the ACC/AHA and ESC/ISH classifications differ? A. The ACC/AHA system defines stage 1 hypertension at 130/80 and stage 2 at 140/90, while the ESC/ISH systems keep a diagnostic threshold of 140/90 with a high-normal category below; both, however, tie the decision to treat to cardiovascular risk. DETAILED. A 135/85 is stage 1 by one and high-normal by the other. CLINICAL. Focus on total risk rather than the label. |
| CARD 2 | Q. Why are the diagnostic thresholds somewhat arbitrary? A. Because cardiovascular risk rises continuously with blood pressure from about 115/75, roughly doubling per 20/10 mmHg, so the thresholds are pragmatic cut-points on a smooth curve rather than biological boundaries. DETAILED. Just below a threshold is not 'safe.' CLINICAL. Hold the continuum in mind and don't treat the threshold as magic. |
| CARD 3 | Q. Which blood-pressure component matters most, and when? A. In younger patients diastolic pressure is a strong predictor, but beyond middle age systolic pressure dominates and the pulse pressure widens — reflecting arterial stiffening, which produces isolated systolic hypertension in the elderly. DETAILED. Isolated systolic hypertension is a real, treatable risk. CLINICAL. Treat the systolic in isolated systolic hypertension. |
| CARD 4 | Q. Why is hypertension managed by total cardiovascular risk? A. Because hypertension is a risk factor rather than a disease, and the same blood pressure carries very different absolute risk depending on the other risk factors, target-organ damage, and established disease — so the decision and intensity of treatment depend on the total risk. DETAILED. Two identical blood pressures may be managed very differently. CLINICAL. Manage by total cardiovascular risk, not the number alone. |
| CARD 5 | Q. What are the components of total cardiovascular risk? A. The blood-pressure level, the classical risk factors (age, sex, smoking, dyslipidaemia, diabetes, obesity, family history), hypertension-mediated target-organ damage, and established cardiovascular, renal, or diabetic disease (which makes the patient automatically high-risk). DETAILED. Risk calculators integrate these quantitatively. CLINICAL. Integrate all four to estimate total risk. |
| CARD 6 | Q. What is hypertension-mediated target-organ damage, and why seek it? A. The silent injury hypertension inflicts before symptoms — left ventricular hypertrophy, albuminuria and reduced eGFR, retinopathy, arterial stiffness — whose presence raises the total risk and often tips the decision to treat. DETAILED. It signals that the hypertension is already doing harm. CLINICAL. Assess for it with ECG/echo, urine ACR/eGFR, fundoscopy, and vascular tests. |
| CARD 7 | Q. Why does treatment benefit scale with baseline risk? A. Because the relative risk reduction from blood-pressure lowering is fairly constant, but the higher-risk patient starts from a higher absolute risk, so the same relative reduction prevents more events — a larger absolute benefit. DETAILED. Higher-risk patients gain more from the same blood-pressure reduction. CLINICAL. Treat higher-risk patients more readily and to lower targets. |
| CARD 8 | Q. Why does the guideline threshold matter less than the risk assessment? A. Because the threshold only tells you the patient has hypertension, whereas the total cardiovascular risk tells you how much they will benefit from treating it — and the benefit, not the label, should drive management. DETAILED. Defining hypertension is inseparable from estimating risk. CLINICAL. Let the total risk, not the threshold, drive management. |
| 20 | PHASE F · LEVEL 20 · APPLY & TEST One-Minute Preceptor |
| SCENE 1 | The intern fixated on the threshold |
GET A COMMITMENT. “You're treating this 135/85 as definitely abnormal because it's above 130/80 — is it that simple?”
PROBE FOR EVIDENCE. “It's above the threshold” — ask: “What does the risk curve look like around that number, and what determines whether to treat?”
TEACH A GENERAL RULE. Risk is continuous and the threshold is a pragmatic line; the decision to treat depends on the patient's total cardiovascular risk, not the label.
REINFORCE WHAT WAS RIGHT. Noticing the elevated reading was correct.
CORRECT A MISTAKE. Assess the total risk before deciding to treat.
| SCENE 2 | The resident treating identical numbers identically |
GET A COMMITMENT. “You've prescribed the same regimen for both 150/95 patients — the young one and the diabetic with prior MI. Why?”
PROBE FOR EVIDENCE. “Same blood pressure, same treatment” — ask: “Do they have the same absolute cardiovascular risk?”
TEACH A GENERAL RULE. The same blood pressure carries very different absolute risk; the high-risk patient benefits far more from treatment, so manage by total risk, not the number.
REINFORCE WHAT WAS RIGHT. Recognising both as hypertensive was correct.
CORRECT A MISTAKE. Stratify each by total risk and treat accordingly.
| 21 | PHASE F · LEVEL 21 · APPLY & TEST Reflective Prompts |
Genuine tensions this evidence leaves open; sit with them rather than resolving them too quickly.
Two guidelines, looking at the same continuous evidence, draw the diagnostic line in different places. What does that disagreement reveal about the nature of disease definitions?
Lowering the threshold relabels millions as hypertensive overnight. How do you weigh the benefit of earlier intervention against the harms of medicalising the well?
Risk-based management is rational but demands a calculation and a conversation for every patient. How do you sustain that in a system that prefers a single cut-off?
Isolated systolic hypertension was long dismissed as benign ageing before trials proved otherwise. What other 'benign' findings might we still be under-treating?
The same number means a different thing in a young person and an elderly one. How comfortable are you treating the number differently in different bodies?
| 22 | PHASE F · LEVEL 22 · APPLY & TEST Board-Style Questions |
| Q 01 | The key difference between the ACC/AHA and ESC/ISH hypertension classifications is: |
| A | One ignores diastolic pressure |
| B | The diagnostic threshold (130/80 vs 140/90) |
| C | One does not use risk |
| D | They are identical |
Rationale The systems differ chiefly in the threshold — 130/80 (ACC/AHA) versus 140/90 (ESC/ISH) — though both tie treatment to risk (case 1, Table 3.1). A, C, and D are incorrect. |
| Q 02 | Why are the diagnostic thresholds described as pragmatic? |
| A | They are randomly chosen |
| B | Cardiovascular risk rises continuously, so the thresholds are cut-points on a smooth curve |
| C | They have no evidence |
| D | They apply only to the elderly |
Rationale Risk rises continuously from ~115/75, so thresholds are pragmatic lines, not biological boundaries (Figure 3.1, Table 3.2). A, C, and D are wrong. |
| Q 03 | Beyond middle age, the dominant blood-pressure predictor of risk is: |
| A | Diastolic pressure |
| B | Systolic pressure |
| C | Mean arterial pressure |
| D | Heart rate |
Rationale Systolic pressure dominates beyond ~50–55 years, producing isolated systolic hypertension in the elderly (Table 3.3, case 3). A predicts in the young; C and D are not the answer. |
| Q 04 | Isolated systolic hypertension in an elderly patient is: |
| A | Benign because the diastolic is normal |
| B | A real, treatable cardiovascular risk from arterial stiffening |
| C | A measurement error |
| D | Only treated if symptomatic |
Rationale Isolated systolic hypertension is a genuine, treatable risk, not benign (case 3, Table 3.3). A, C, and D under-treat it. |
| Q 05 | Two patients have a blood pressure of 150/95. They should be: |
| A | Managed identically |
| B | Managed by their total cardiovascular risk, which may differ greatly |
| C | Both observed only |
| D | Both treated maximally |
Rationale The same blood pressure carries different absolute risk, so management follows total risk (case 2, Figure 3.2, Table 3.6). A, C, and D ignore the risk difference. |
| Q 06 | Which makes a patient automatically high-risk regardless of the exact blood pressure? |
| A | Young age |
| B | Established cardiovascular, renal, or diabetic disease |
| C | A normal ECG |
| D | A single high reading |
Rationale Established CVD, CKD, or diabetes places the patient at high absolute risk (Table 3.4). A lowers risk; C and D do not confer automatic high risk. |
| Q 07 | Why does the absolute benefit of blood-pressure lowering scale with baseline risk? |
| A | It does not |
| B | The relative reduction is constant, so a higher baseline risk yields a larger absolute benefit |
| C | Lower-risk patients benefit more |
| D | Benefit is unrelated to risk |
Rationale A constant relative reduction applied to a higher absolute risk prevents more events (Table 3.6, L13 row 6). A, C, and D are incorrect. |
| Q 08 | A borderline blood pressure with left ventricular hypertrophy and albuminuria should prompt: |
| A | Reassurance and no treatment |
| B | Treatment — target-organ damage raises the risk and signals ongoing harm |
| C | Repeating the BP only |
| D | Ignoring the organ damage |
Rationale Target-organ damage raises the total risk and tips the balance toward treatment (case 4, Table 3.4). A, C, and D overlook the organ damage. |